What’s clipping our wings?

Source : Bloomberg News

The Indian civil aviation industry, with a size of $16 billion, is among the top 10 globally. It has grown at a CAGR of 17%, which, if sustained, could make it the largest aviation market by 2030. Entry of Low Cost Carriers and thrust on development of modern airports has expanded the market from business class and corporate to the middle class, who have the potential to become the largest and most lucrative customer segment.

Untitled

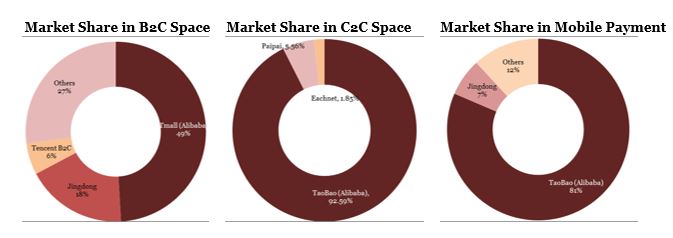
Figure 1: Indian commercial aviation sector

The Make-In-India program is designed to facilitate investment, foster innovation and build manufacturing infrastructure in a number of key segments that are instrumental in India’s growth and progress. In the aviation sector, the government has announced a number of key policy initiatives, such as 100% FDI in greenfield airport projects and 49% FDI in domestic passenger airlines, along with budgetary support in terms of investment and exemptions. However, there exist a lot of regulatory and taxation hurdles for airline companies in India, and measures need to be taken to support the development of the aviation sector in India.

Essential Air Services Fund (EASF): Connectivity between Tier-2 and Tier-3 cities is low due to air carriers refusing to operate flights on those routes as they perceive them to be unprofitable, due to low volumes. A proposal exists, for airlines to contribute a percentage of each ticket sold to a common fund which can be used to cross-subsidise air travel on unprofitable routes. This is similar to a fund in the telecom sector where operators contribute 5% of their gross revenues to a universal service obligation fund, which is used to provide telephone connectivity in rural areas. A similar policy in aviation would enable increase in connectivity on less busy routes.

Modification of the 5/20 rule: Currently, Indian airlines are required to have a minimum fleet of 20 aircraft and 5 years of operational experience to start international services. This serves as a deterrent for new entrants, who want to operate flights in the more profitable international segments. Instead, the policy can be modified to allow airlines to accumulate flying credits by deploying capacity on domestic routes, with additional credits for providing connectivity on routes deemed unprofitable. Also, the minimum operational experience requirement can be revised to one year. This will help improve domestic connectivity and attract more entrants in the aviation space.

Fuel taxation: High tax rates of 3-30% on Aviation Turbine Fuel (ATF) have made ATF in India 60% costlier than that available in ASEAN countries. Along with state and central taxes on ATF, there exist service taxes on air tickets and high airport charges, which are throttling Indian airline carriers’ competitiveness and adding to their debt burden. A comprehensive look at the taxation policies is required, with reduction in extra taxes.

MRO taxation: Airlines in India spend 13-15% of their revenues on Maintenance, Repair and Overhaul (MRO), making it the second largest cost component for airlines. Myopic policies regarding indirect taxes such as VAT and Service tax, along with laborious customs procedures regarding import of spare parts and consumables, has led to most airlines flying empty aircrafts to MRO facilities in foreign countries for servicing. Merely 5-10% of MRO work for domestic carriers is carried out in India. This represents a huge lost opportunity in terms of revenue and jobs. A task force needs to be set up to review the policies and modify the taxation regime to develop the domestic MRO industry.

Infrastructure development: There has been a thrust on development of infrastructure, particularly new airports, but there needs to be focus on developing low-frill airports under Public-Private-Partnership schemes. Also, a key impediment to growth of airline capacity in India is lack of availability of hangar space at key international airports, which needs to be addressed.

While the initiatives under the Make-In-India program serve as a good starting point, a comprehensive overhaul of aviation policy is required to achieve the growth targets and make Indian aviation competitive from a global standpoint.

—————————————

Arundhati Hazra is a second year student at IIM Ahmedabad. She graduated from NITK Surathkal with a B.Tech in Electrical and Electronics Engineering, and worked for three years, in ST-Ericsson and AMD, before coming to IIM Ahmedabad. She enjoys reading, writing and quizzing. She interned with McKinsey and Company during summers.

Exploring the meteoric rise of Alipay

The birth and rise of Alipay

Launched in 2004, Alipay is Alibaba’s third- party online payment platform in China. Alipay is to Alibaba just as PayPal is to ebay i.e. a payment portal, which processes the online payments not only for Alibaba but also for other e-tailers. While Paypal has mostly focussed on the Western market, Alipay prime focus is its birth country – China. This is justified considering its fast-growing third-party online payment market. However, unlike ebay or Amazon, Alipay enjoys favourable market penetration in China.

P1


p2

300M+ registered users

 12.5B transactions

 3x: value of transactions compared to Paypal and Square

With over 300 million registered users trading with over 460,000 Chinese businesses to drive 12.5BN transactions, Alipay has the largest (about 50%) market share in China both in terms of number of users and volume of transactions online. Not only in the domestic market, Alipay has tied up with 300 worldwide merchants to trade in 12 foreign currencies. The domestic and international volumes drive over $520BN transaction revenues and are greater than the volume of transactions at ebay and Amazon put together.

Drivers of growth

The journey to becoming China’s leading and world’s 3rd online payment provider has been a steady one. The meteoric growth of Alipay rests on (3) key factors-

  1. Alibaba Advantage: Alibaba’s performance has been the growth engine for Alipay.

P3

At the right place at the right time.

The e-commerce market in China has boomed over the past decade. Its revenue growth (2009-2012) has topped 70% compounded annually. Driven by social media and advent of mobile/smartphones, the market is expected to continue to rise and outperform the US e-commerce market for another half a decade. Alibaba has capitalised on the growing China market through Taobao and Tmall.

The following charts show Alibaba’s market share in 2013 in various segments –

Pic 42. Differentiated offerings

 Unlike its competitors, Alipay provides two key services that satiate both the buyer and the seller. These two value additions have significantly differentiated Alipay from its competitors and  helped in building trust, thereby strengthening the network effect.

Consumer Protection. In light of the volume of consumer complaints in the e-tailing business, Alipay ensures buyer protection through its escrow service. It collects payment from the buyer but releases it to the seller only if the buyer confirms her satisaction with the delivered product.

*78% respondents were concerned about the authenticity of items sold online.

The following flow diagram illustrates the model –

Pic 5

No Fee Is The Key. Alipay is the preferred payment platform for a host of domestic and international sellers. This is primarily due to its competitive and simple fee structure. It does not charge any fee on Taobao and charges a nominal fee of 0.5% – 1.5% to Chinese sellers on Tmall. PayPal, on the other hand, charges anywhere between 2.9% to 3.9% in addition to $0.3 per transaction and cross-border transaction fees.

 3. Banking on Financial & Investment Services

 Alipay added another feather to its cap in 2013 by introducing Yu’E Bao, its financial & investment services arm for retail customers. With a promise to pay returns greater than what Chinese banks pay, Alipay tied up Tian Hong Asset Management to launch the Yu’E Bao service.

This was a unique service as it was only once that Paypal attempted it in the US before shutting it down in 2011. Also, this service was direct competition to the traditional banks. While traditional banks provide about 3.3% returns on a savings account, Alipay’s returns are more than twice as much (about 7%). Simple maths has given a boost to the investment sentiment amongst the retail customers. This is evident in the sharp rise in the number of users of this service, which rose from 2.52MM in June 2013 to more than 100MM users in June 2014. The assets under management grew 5 times in the past year from $7Bn to $40Bn. The steep rise has been bolstered by a profit of $0.5Bn profit to its customers. Thus, there is clear monetary incentive for customers to leverage Alipay’s savings accounts.

Alipay has coupled high returns with convenience of usage. Customers can transfer amounts as low as 16 cents, and can withdraw money anytime without being penalized. Integration of messaging and alert services through mobile phones has been the icing on the cake. But are high returns and convenience enough to sustain internet finance, and by some extrapolation Alipay’s USPs?

 The Road Ahead

 In light of a majority share in the growing Chinese e-commerce market, Alipay is surely on the right track for a couple of reasons. Firstly, Alibaba’s brand name and trust will have a huge network effect in looping in more customers and sellers. Secondly, its unique escrow model and zero-domestic fee right from the beginning has given Alipay the first mover’s advantage in terms of protecting buyers and unlocking economies of scale to sellers. This effect is compounded by lack of differentiation and value added services from the competitors. Finally, launching forward looking internet financial services has added value to brand. Thus, with major threat in the foreseeable future, Alipay is set to become a one-stop shop for banking, wire servicing and investing, all done through mobile device. So much for amenities on the go!

Management Consulting: First Impressions

So it’s been a little more than a month (my internship, not counted) since I started with my first project – perfect time to build first impressions!

On the one hand, it’s a jungle out here. With so much happening every minute you can’t help but feel that you’re running just to stay in the same place. Of course with the pressure of expectations, extreme ambition and the resulting aggression you almost expect someone to kick you down a well and shout “this is Spartaa” every other minute.

So life in a consulting firm is tough (big surprise) – the travel itself is enough to sap all energy out of you (for my first stint, I catch a flight, then a cab, followed by an overnight train, and then another cab – just to reach my client place). Not to mention the impossible deadlines, out of the world expectations (from clients, the team and most importantly, yourself) and the constant pressure to deliver. And not just deliver, do better than most of the rest – because only a select few manage to reach the next level – at every level. Late nights over countless cups of coffee are a given – and for someone who takes stress easily, health will be a major concern very soon.

So this is probably the first thing anyone will realize here – consulting is not worth all the late nights, stress, lost opportunities (work, sleep, social life – choose 2/3 at max) if you don’t enjoy the process. Here’s another thing I realized – the way to enjoy the process is not to look at a snapshot of what I am doing every second (that’ll look like mundane work 80% of the time) – but look at it within a reasonable timeframe (where the full impact of what you did is visible). Because most of the satisfaction at work comes when I can see what we have achieved for the client and for myself.

This past month has been a crazy one – with me struggling to get accustomed to this new way of living, thinking and functioning (of course this new way keeps changing every two weeks and definitely with every project!) – but within just a month, I see a difference in how I work – I can be a lot more focused; I have started internalizing the discipline of prioritizing the most important (and not the easiest) tasks first; excel spreadsheets don’t slow me down (that much) anymore (even though my laptop does, quite often); I am more cognizant of the client’s perspective now; and (I think) I am getting better at setting more realistic short-terms goals. And all this, while I felt like I was just going through the motions, without even deliberating on the learning aspect.

The steep learning curve, which consulting firms promise to provide, is pretty real!

A partner joked about it once, saying “it is true that you will learn in 2 years, what most of your batchmates from business school will in 5 years – but that will be mostly, because you’ll end up doing 5 years worth of work in 2 years!”

I may have made it sound, so far, like the learnings have all been tactical* – that is fortunately not true!

Whoever said business school is the last time you will find real intellectual challenge, would have been pleasantly surprised at what (s)he experienced at a consulting firm – I am learning about concepts and aspects of business, which I missed out heavily on while at school. I never understood, for example, the real essence of corporate governance – till I sat in one some meetings with CXOs of a company (people who are still at business school, do take a couple of courses on corporate governance). I’ve also started thinking a lot more in terms of systems and processes – I can actually see them in front of me – and I understand how bad processes can make even high-performing organizations crumble in no time. I can see why some spectacular start-up founders ultimately lead their companies to a spectacular demise when it’s time to scale. And now I see IT in a completely different light – with utmost respect even.

I can clearly see why consulting firms are titled “Finishing Schools” by many – in a very short time this experience is going to change the way I think –and hopefully all for the better. At IIMA, I learnt discipline, core business concepts and a way of looking at things from multiple dimensions; now this experience is going to make me a lot more (for want of a better word)“professional” in my approach.

At the very least, I expect the next couple of years to make me a stronger problem solver, a more rigorous thinker, an effective communicator and a better manager overall.

 *I would also like to mention, in passing, some other useful life skills that I have acquired – like tying a tie windsor while on a conference call in a cab; the ability to pack a suitcase in 7 minutes flat or optimizing my travel time to be ‘Just in Time’ for every flight

** The views expressed above are personal views of author and should not be associated with any firm.

————————————————————–

Sahil Patwa is consult club alumni from PGP’14 batch. He holds a B.Tech in Mechanical Engineering from IIT Bombay

GE’s Alstom Acquisition: How Smart is the Move ?

On June 22nd 2014, one of Europe’s fiercest acquisition battles ended. French Government officially supported Alstom’s purchase from General Electric. During the previous two months, Siemens and Mitsubishi also played important roles in the bid. Both strategic and political reasons lie behind the structure of the deal.

On April 30th, Alstom (€21 billion revenues) presented the details of the proposed acquisition from GE (€120 billion revenues): all assets and liabilities related to the Energy activities transferred to GE for an Enterprise Value of 11.4 billion Euros to be paid in cash.

Figure 1

Source: GE Website

Is the deal value fair ? 

By using the comparable method, it emerges that GE has undervalued Alstom. Indeed, GE’s offer implied a EV/EBITDA multiple equal to 7,87, while Damodaran suggesting that a fair multiple for the sector should be equal to 9,78 and Valuemetrics to 10,44.  The main reasons of this undervaluation may be the industry trend and Alstom’s recent performance.  According to an Ernst & Young research of 2012, the M&A trend in the power and utilities industry has been decreasing in terms of value and number of deals. Considering similar transaction multiples of the recent past in the European market, they confirm the trend and are similar to the ones of Alstom’s acquisition. For example, in 2012 Electricite de France acquired Edison International with a EV/EBITDA multiple of 9.7 and Snam was acquired by Cassa Depositi e Prestiti with a multiple equal to 8.7. Moreover, the whole European energy sector has been facing threats due to the raise of energy resource prices.  Alstom has also negatively performed in the last years. In 2013, Net Income fell 28% to €556 million due to higher restructuring costs. Operating Profit fell 3% to €1.4 billion, with Operating Margin dropping from 7.2% to 7% and orders to 10% (€21.5 billion) because of a weak performance in the thermal power division.

The underlying strategy

The strategic rationale behind the deal is to integrate the Alstom energy activities (€14.8 billion revenues and 65.000 employees) within GE to strengthen its development’s prospects. The main sources of synergies are the complementary capabilities among the two firms: GE’s excellence in Gas Turbines and Wind Onshore and Alstom’s superiority in Hydro, Grid, and Steam turbines. Moreover, Alstom could use the cash received to refocus on the transportation sector.

The deal is likely to be very successful due to various elements. It strengthens GE’s position as the most competitive infrastructure Company in the world. Moreover, the type of technology that is going to be acquired is complementary to the existing capabilities of the company, thus increasing the likelihood of benefiting from the potential synergies in the short-term. Indeed, the synergies that GE is going to leverage are concrete and clear because Alstom mostly conducts business in areas where GE is already present, so the learning curve necessary to generate value is not very difficult to be achieved.

The benefits that GE is more likely to achieve are in the power business, especially regarding the production of clean energy. Indeed, the demand of pollution-free energy is likely to increase in the near future, especially from Asian countries like China or India. Thus the acquisition has taken place in an opportune moment in terms of industry cycle and given the huge scale that the company is going to put in place, it will be able to largely satisfy the future demand.

According to estimates provided by GE, the cost synergies opportunities that the company is expected to generate is about $1.2 billion within 2020 (see graph below for a more articulated analysis), a $4 billion increase in operating profits by 2018 and an EPS increase of $.04-.06 within 1 year.

 Another relevant factor is the past success in dealing with acquisitions of France and European companies. Among them we remember Jenbacher, an Austrian company that has been the cornerstone of GE’ global distributed power business and that under GE’s control has increased revenues 3x times. This success ranges also from various industries, not only in the power sector, ensuring that the post-merger integration phase will be conducted appropriately by GE given the previously developed skills.

 What are the Challenges ?

 Although the deal has a huge potential to be very successful, it is not immune to risk. The first important point that GE should be aware of is the strength of the France unions in the context of the France labor market. Any time it will take decisions regarding the firing or the reconversion of the France labor force may be very difficult to be implemented (or may be implemented at higher costs than in other countries of the world).

Another risk factor is the large amount of transactions costs that will be present as soon as the deal will be completed. They mainly derive from the terms of the deal, which require the constitution of three Joint Ventures that were not present in the first bid by GE. Thus, GE will face much more pressure in generating profits given the larger cost structure.

 Figure 2Source: Author’s elaboration on company’s data

Conclusion

 The deal has high chances to turn to be very successful and may be considered as a game changer in the industry. Although the initial terms had to be modified by GE due to the competition that arose from Siemens-Mitsubishi, the benefits are both large and concrete, and very likely to be monetized in the short-term. This is also related to the nature of the estimated synergies. Indeed, they are of the cost-saving type, which have a higher probability to be achieved compared to the growth ones. However, challenges arise from the institutional environment that surrounds GE’s activities in France, where the power of unions is very high as well as the high amount of transactions costs that arose in order to positively conclude the deal.

 ————————–

Gianmarco Bonaita is a Double Degree student of PGP coming from Bocconi University. He completed his undergraduate degree in Business Administration and Management at Bocconi University. He has been elected city councilman and has worked as a collaborator of journal for 3 months. He has had an internship in an Italian SME. He is passionate about travelling, skiing and photography.

Should there be a “Right to Bank Account?”

Financial inclusion (FI) has become one of the top priorities of federal banks and governments across the globe. The issue demands an even greater importance here in India as the financial inclusion situation is grim. Despite being the Asia’s third largest economy, nearly 40% of the people don’t have a bank account. An RBI panel headed by Nachiket Mor, a member of the RBI’s central board, recently proposed a new class of banks, christened as “payment” banks, to be set up to enhance the coverage of financial services in India. This is a step in the right direction and this article argues as to why should the people demand for a “right to bank account”?

Financial inclusion, as defined by Zeti Akhtar Aziz, noted Malaysian economist, is “About providing an opportunity for the world’s 2.5 billion unbanked and financially underserved to participate in the formal financial system…” The global financial crisis of 2008 acted as an eye opener with regards to the importance of financial awareness.  Bringing the “financially untouched” population into the mainstream banking would not only improve their lives, but also bolster the economy.

blg1Source: Livemint

In the absence of financial inclusion, unregulated lending services sprout up. They usually ask for very high interest rates and repayment period is too short for any productive investment. They can get bullish in nature and leave customers to pay through the nose. Kate McKee, a behavioural economics expert, claims that a person caught in the claws of private moneylenders shows declining decision making and crisis management skills. This degrades performance in any profession.

Financial inclusion benefits the economy in multiple ways. It provides an easier way for the state to transfer benefits to people. It will eliminate leakages and curb corruption. Thus, the result would be a reduction in the government’s subsidy bill and putting the public money to more efficient use.

Another benefit is that having a bank account will encourage people to save money, and deposits could be used to extend capital to businesses. Growth in the formal banking sector is known to reduce reliance on “black” money for financing. Availability of affordable and adequate credit from the banking sector is known to boost the entrepreneurial spirits of people.

Achieving inclusion in the country of one billion seems a humongous task, and it indeed is, but as the old saying goes, “where there is a will, there is a way.” Several developing countries have taken innovative measure to address the issues, and the results are stellar. Kenya, for example, has leveraged the widespread presence of mobile phones to introduce a mobile-based financial services system called “M-PESA”. It is used by one-third of their population for cashless transfers, savings, financial transactions, etc. and could be replicated in India.

blg2

M-PESA Model: How it works

Even private lenders can be made a part of the financial inclusion system under strict regulatory control. Brazil has in place a network of 95000 banking agents who have helped pull around 13 million people into mainstream banking. Bangladesh has adapted its regulatory framework to suit the growth of women-led micro financing institutions.

The biggest obstacle to relaxing the norms for banking growth is the fear of banking services being exploited for money laundering or even worse, funding terrorist activities. Financial Action Task Force, an intergovernmental body, was established in 1989 to counter these issues. Mexico has tried to address the issue by having “tiered” regulatory framework. Low-value accounts relax on the background checks but are subjected to more stringent transaction restrictions.

In 2008, more than 80 developing countries came together to form the “Alliance for financial inclusion,” an international knowledge sharing network to discuss and design policies on financial inclusion. Seeing the momentum in world economies towards financial inclusion, RBI acknowledged that it is the need of the hour. Based on the proposals of panels and think tanks, it has taken several steps for the expansion of financial institutions in rural India:

  • No frills accounts: These are the most basic accounts which offer only the basic services. These accounts have zero balance requirements and have helped attract more than 12 million Indians into formal banking.
  • Relaxation of Know Your Customer (KYC) requirements: No frill accounts can be opened up by showing up any one of a variety of photo IDs. For low-risk individuals, full KYC data updating exercise has to be carried out only after every ten years as compared to the norm of five years.
  • Banks at the doorstep: The introduction of information and communication technology, e-commerce, financial inclusion fund and online updates on markets, etc. have brought banks to the doorsteps.

The statistics presented below shows that these measures have achieved partial success in increasing the penetration of financial institutions in rural areas. “Crisil Inclusix Index” is used as a measure of FI. It collates three crucial parameters of bank penetration: branch penetration, deposit penetration and credit penetration. The Index has increased from 40 to 35 in the last five years, but it is mostly high for the states with high literacy. This implies that the poor, uneducated people who truly need an account are still excluded.

blg3Source: Livemint

 Under the recent proposal of RBI, existing banks are going to be allowed to open subsidiaries serving as payment banks. The Panel further proposes to have a universal electronic bank account (UEBA) for every person on the lines of the Unique Identification card scheme of central government.  Experts welcome the Mor’s proposals and believe that the concept of “payment banks” could prove to be a game changer. As Shinjini Kumar, head of banking at PWC India commented in financial express “I definitely think the proposed payment banks are better suited to achieve the objective of increasing penetration compared to the universal banks,”

Financial inclusion of the bottom half of the financial pyramid is an arduous, but crucial task that requires government will, support from leadership across political parties and careful policy crafting by RBI. We have this opportunity of leveraging the dormant potential of the financially secluded section of our economy. Who knows, it may herald a new era of growth and prosperity for all. So yes, it is time for government to give some serious thought to “Right to bank Account.”

————————–

Vaibhav Kumar Singh is a PGP-2 student at IIM Ahmedabad and a member of Consult Club. He did his internship with The Boston Consulting Group. Prior to joining IIMA, he worked as a Software Development Engineer at Microsoft and as a research scholar at INRIA, France. He is a graduate in Computer Science & Engg. from IIT Jodhpur.

Open Source: A paradigm shift for the IT Industry

Open Source is the biggest disruptor the software industry has ever seen and it will eventually result in cheaper software and new business models…

-Gartner

Gartner’s predictions now suggest that in coming years, OSS’s impact on application software will cross $19 billion, with a five-year CAGR of 44%. With the Open Source Initiative (OSI) organization and thousands of developers worldwide backing OSS, its impact on the $170 billion IT industry needs a closer look.

Image

Major players in the open source space

Open Source Software (OSS) is collaboratively developed computer software with its source code made public. Over the past decade, OSS has seen rapid growth in the industry owing to the price, reliability and flexibility benefits it offers. The growth of Open Source Software (OSS) has altered the fundamental nature of the industry in a true sense as an increasing number of business models are switching to OSS. It has given rise to major implications for the IT industry while also carving out niche segments in the industry such as Open Source Consulting etc.

THE GROWTH STORY

So why has OSS grown exponentially? What factors have driven software giants to using as well as publishing open source?

The biggest factor that propelled OSS onto the main stage was the cost advantage, but, contrary to popular belief, it is not the only benefit that organizations derive from OSS:

Security – Linus’s Law (named after Linus Torvalds, Linux creator and OSS pioneer) states, “Given enough eyeballs, all bugs are shallow”. OSS offers enhanced security by leveraging the strength of its developer base to quickly identify and fix bugs.

Quality – OSS offers immensely better quality of code. Imagine thousands of developers constantly striving to innovate and contribute to an OSS versus a handful of developers shipping out a licensed software package.

Trial & Support – OSS also offers great trial and support options. As the code is free, organizations can try it out at will, and with hundreds of communities and online forums of open source developers, support is never far away for the users.

Flexibility – Other benefits come in the form of amazing customizability, freedom and flexibility the code offers. Organizations typically tweak the code with minimal effort to best match their requirements, a relatively well-known example being that of Goobuntu, a ‘long term support’ version of Ubuntu developed and used in-house by Google.

Hybrid Business Models

In addition to pure open source companies, the growth of OSS has been fueled by proprietary software companies pursuing a ‘hybrid’ business model. There have been numerous instances of software giants open sourcing some of their products: Adobe open sourced its Flex tool while Yahoo did so with the Flickr API. This has lent credibility to the OSS bandwagon and prompted firms and venture capitalists to invest in open source. In September 2013, IBM announced a gigantic $1 billion investment in the Linux platform.

MAJOR ISSUES

OSS has been able to penetrate almost all sectors of the software industry, ranging from ERP to Server OS and has made inroads into the public consumer segment as well (as depicted by the graph). While OSS continues to grow unbounded, it becomes critical to address the problems associated with OSS. The biggest gray area for OSS is legal uncertainty. There are unaddressed issues with the interpretation of open source licenses (such as GPLv2) which use an array of loosely defined terms such as ‘derivative work’.

Open Source Software Usage Adaption (%age)

Open Source Software Usage Adaption (%age)

Another problem lies in the management of OSS on a large scale. Many companies build their core business models on top of an open source code or platform. This necessitates the formulation of a sound usage policy, failure of which could hugely devalue the product. This was the case with Cisco’s $500million acquisition of Linksys where the Free Software Foundation successfully claimed release of open source based elements of Linksys. Other trivial issues include limited user-friendliness and lack of ‘formal’ technical support. The growth of OSS is sustainable only if these issues are eliminated, otherwise, the software industry will soon be entangled in a web of lawsuits, plagiarism and uncertainty.

WHERE IS THE FUTURE?

Three distinct schools of thought from the software world have sparked the Open Source vs. Free Software vs. Closed Source debate for paving the growth of the industry. While advocates for Closed Source bank upon benefits such as saving intellectual property and minimizing competition, they restrain innovation and reusability for the industry. On the other hand, Free Software offers unmatched cost benefits and a ‘morally right thing to do’ argument, while suffering from loopholes such as poor quality and low accountability. In such a business environment, open source attempts to pave a middle way promising highly flexible, reliable code at minimal cost. But with the open source issues remaining unaddressed, the promise might not always be realized which means that the three-fold software debate continues to heat up.

 ———

Abhinav is a PGP 1 student at IIM Ahmedabad and a member of the Consult Club. He holds a Dual Degree in Computer Science from IIT Roorkee and has worked at Adobe for 10 months before coming to IIM Ahmedabad. He will be interning with the Boston Consulting Group. He is passionate about reading, traveling and playing volleyball.

Hello? Rural India calling!

The advent of mobile phones in the past decade has led to an undeniable transformation of the landscape of the world. It has touched the lives of everyone – from the banker to the boatman. As the cellular phone continues its surging progress towards ubiquity, we shall examine how it is affecting the lives of the Indian farmer, and changing the face of agriculture in rural India. 

Mobile Telephony in Agriculture

In the field of Information and Communication Technology for Development, or ICT4D, mobile phones are touted as a potent tool for development. The sheer scale of global adoption of mobile phones in the last decade perhaps lends credibility to this fact. Even within India, the last decade has seen a steep rise in mobile phone subscriptions, with a wireless teledensity of 70.57%, as of January 2013. With the saturation of the urban market and the rising popularity of the Bottom of the Pyramid concept, mobile phones have penetrated deep into rural India.

Image

With its ability to offer wide and rapid outreach across a large geography, it is no surprise that mobile phone technology has its applications in the field of agriculture. Enabling higher speeds of information exchange, it brings farmers, organizations and markets closer to each other, with the direct fallout of greater transparency and leveraging power to the usually downtrodden farmer.

Case Studies: Mobile-based Services for Farmers

The opportunities of using mobile phones in agriculture are immense, and subsequently, there have been a plethora of mobile-based services targeting farmers. Some are listed below:

Reuters Market Light, a subsidiary of Thomson Reuters, provides personalized agricultural information over mobile phones to the farming community, to a cumulative subscriber base of over 1 million across 13 states.

Ekgaon Technologies, started by an Ashoka Fellow, offers a service called ‘OneFarm’ in Gujarat, Rajasthan and Tamil Nadu, that provides soil-specific nutrient recommendations to the farmer through an automated system in local language via mobile phones.

Recently, ITC Ltd. Launched an interactive mobile telephony system called ‘Namma Sandesh’, that provides crop advisory, market prices, weather forecast and local news to tobacco and ragi farmers in Karnataka.

The Benefits

The introduction of mobile phones has changed agriculture in multiple ways.

First, it has helped farmers make more informed choices. It has helped connect farmers separated by vast distances, enabling the sharing of knowledge on best practices. Moreover, tailor-made weather forecasts add weight to his crop decisions.

Beyond this, it has enhanced his access to markets and mandis previously out of reach. No longer can the middleman use information asymmetry against the gullible kisan (farmer) – information from markets around the world is now at his fingertips.Beyond these, mobile telephony has helped in rapid transfer of information across vast distances. This is critical because a few hours can make all the difference during a pest or disease outbreak.Finally, it has helped empower the farmer with information, opening new doors in terms of opportunities and knowledge.

The Challenges Ahead

While there has been significant contribution of mobile phones in rural India, there are many hurdles to be overcome.

The major hurdle is simply technological and financial considerations. To develop infrastructure for improving mobile networks in rural India would require the willingness of companies to invest for low initial returns. The financial burden of setting up infrastructure could be reduced by sharing of networks by carriers.

While mobile connectivity is high in rural India, mobile data (or GPRS) is yet to catch up. This restricts farmer-oriented services largely to text SMS or voice as the mode of communication.

This restriction is compounded by the low levels of literacy, and tech-literacy in far-flung areas. As voice is expensive, most services focus on text SMS-based service delivery. However, many handsets do not support Indian language text and English is little-known in villages.   

There is also the issue of the quality of content delivered through various services. From the content to the delivery, there are many challenges faced in designing effective services for the Indian farmer. Innovation and creativity are much-needed, and the content has to be packaged for the local socio-cultural setting.

As a final word, it would be wise to remember that mobile telephony, just like any technological innovation, is not a panacea. Its interactions with the social fabric are complex. For example, in a typical rural family, the head of the house owns the phone – a subtle reinforcement of existing power hierarchies.

Thus, mobile telephony has rewritten the story of the rural farmer. It has shrunk the distances separating him from the rest of the world and brought information to his fingertips. It has brought services that reduce the risk of crop damage or failure, and improved his access and aspiration levels. There is, however, a long way to go. Technological, infrastructural, content-related and social challenges need to be overcome.  

 ———

Girish is a PGP-1 student of IIM Ahmedabad and a member of the Consult Club. Prior to joining IIMA, he graduated from the Indian Institute of Technology, Madras with a B.Tech in Mechanical Engineering. He loves music, reading and discussions, and is passionate about the social sector.

Consolidating the Cement Industry – Brick by Brick

It was recently announced that Irish specialist CRH is to acquire a controlling 51% stake in the two 2.4 MT plants in Gujarat of the Jaypee Group, the country’s third-largest cement producer, the deal reportedly valued at an enterprise value of Rs 4,200 crore. CRH had earlier acquired MyHome Industries in 2008. This foreign direct investment signals renewed consolidation in the Indian cement industry which had reached its peak in the last decade. This is a fresh respite from the ongoing concerns among global buyout firms about investing in India since returns have gone down due to rupee depreciation, increasing costs of production and policy paralysis and hence the prospects of the Indian cement sector were on the verge of a downtrend.

Indian cement industry – an overview

Driven by domestic GDP, cement demand in India has grown at a CAGR of ~9% in the past decade. Demand for cement is closely driven by the construction sector which in turn is correlated to growth in GDP. With growing Indian GDP, there has been an increased focus on infrastructure development along with a growth in demand in the housing and industrial sector.


Demand-supply is typically balanced in all regions of India i.e. North, South, East, West and Central. The West is a net importer of cement followed by East which imports some cement. South and North are the both the biggest consumers and producers of cement. They account for 49% of the total consumption and 55% of the total production of cement in India.

The Budget this year removed a 5% duty on coal imports (cement makers import 25% of their coal); there is no import duty on cement. Cement will gain from rationalization of taxes and duties and a simpler excise duty regime. There is increased pressure on the government to completely remove the import duty on gypsum which is an essential product for the cement industry.

Consolidation – History

Globally, most cement markets have witnessed significant consolidation. After the dismantling of government controls for the cement industry in 1989, the rate of growth in capacity addition in the cement industry increased. Due to the increased production and the lack of matching consumption, there was excess capacity in the market which resulted in companies struggling to remain viable. Entry of foreign players resulted in the consolidation of the fragmented industry. Though the industry has seen consolidation by domestic players starting in the mid-1990s, it was only in the late 1990s that foreign players entered the market. Holcim entered India by investing in Kalyanpur Cements in 1990 and Lafarge commenced its Indian operations by acquiring Tisco’s cement plants in 1999.

Consolidation – Last decade

In the past decade, there was a wave of consolidation in the Indian cement industry. A number of large mergers and acquisitions were witnessed. In most cases, global companies have acquired regional players. In the period of high growth, large players, in order to increase their market share and establish pan-India presence, have followed the inorganic route of acquiring small and regional players. Grasim as a part of Aditya Birla Group (ABG) acquired a controlling stake in Ultratech Cement from L&T in 2004. In the same year, Holcim acquired 40-45% stake in Gujarat Ambuja Cements and ACC. Recently, Grasim merged into Ultratech to create a single entity. Other than these major mergers and acquisitions, Heidelberg cement acquired Mysore cements (2006), Italcementi acquired Zuari Cement (2006) and Vicat acquired Sagar Cements (2008).

As a result, currently, there are only 2 pan-India players – ABG & Holcim, together accounting for ~38% of the capacity. Top 19 players account for 87% of the capacity. The Eastern reagion enjoys the highest level of consolidation in the industry with the top 5 players occupying over two-thirds of the total market share.

In spite of the rupee depreciation, Indian cement industry is an attractive option for FDI primarily due to its size and growth prospects. India is the second largest cement producing country in the world. During 2007-12, the cement capacity in India almost doubled to around 300 MTPA. As per projections in the 12th Five Year Plan, the cement sector would need to raise its capacities to 470 million tonnes by 2017 to meet the rising requirement for the commodity. Entry into the market is relatively easy since there are some loss-making companies which can benefit from the infusion of funds.

The advantages of consolidation have been witnessed for over a decade now since sustained merger and acquisition activity in cement has led to much improvement in profitability and valuations in the sector. First of all, consolidation reduces sprinkling of capacities and boost competitive pressures. There is a better opportunity to tap in economies of scale which is likely to control cement prices. With the demand in the cement sector poised to grow over 9% in the next two years, increase in prices is a huge concern. Thus, consolidation amy help in stabilizing prices.

Secondly, the top 5 players after consolidation enjoy a better cost structure, driven by higher level of vertical integration and locational advantage with respect to sourcing of raw materials and market access. Most other players have a weaker cost structure and moderately high leverage levels.

Thirdly, the financial strengths of the acquiring companies could help rescue assets which are loss making at present.

However, cartelization remains a possibility since the top five players control half the total capacity. Recently, the Competition Commission of India (CCI) has slapped 11 cement companies with a fine of Rs. 6,304 crore for price cartelization, the highest penalty ever imposed by the fledgling, but increasingly assertive, anti-trust regulator. It is predicted that the levy of penalty will lead to further consolidation in the industry. Considering the long term growth story, fair valuations, fragmented structure of the industry and low gearing, another wave of consolidation would not come as a surprise.

– by Kirtika Sharma

Kirtika is a PGP-1 student at IIM, Ahmedabad and a member of the Consult Club. She graduated from IIT, Delhi in 2011 with a B.Tech in Textile Engineering and has worked for AT Kearney as a Business Analyst for an year

Who Moved my Oil

If you had to take a guess at the companies that were involved in the chain of operations, from the oil field, to the fuel that you filled into your car, what would it be? Most people tend to associate the petroleum industry with one of the Supermajors: BP plc. (formerly British Petroleum), ExxonMobil, Royal Dutch Shell, Chevron Corporation, Total S.A. and possibly ConocoPhillips.

Big Oil is definitely big. The Supermajors are not only the world’s largest public oil companies; they are also the world’s largest corporations.

Company 2011 Revenue ($ Billions) 2011 Profits ($ Billion)
Royal Dutch Shell

484.5

30.92

ExxonMobil

452.9

41.06

BP

386.5

25.70

Sinopec

375.2

9.45

China National Petroleum

352.3

16.32

Chevron

245.6

26.90

ConocoPhillips

237.2

12.44

Total S.A.

231.6

17.07

Source: Fortune Global 500

However, the annual revenues and profits of publicly traded companies is only a part of the picture as far as the oil industry is concerned.

Image

Source: Wikipedia

State owned firms dominate the industry. Most of these firms are fully owned and privately held by the respective states and do not need to declare their revenues or earnings.  However, in terms of oil and gas reserves, state owned National Oil Companies (NOCs) clearly dwarf the Supermajors. NOCs control over 80% of the World’s oil and gas reserves. In terms of reserves, Exxon is the 11th largest oil and gas company in the world.

NOCs are also the world’s largest producers of oil. In 2011, PetroChina announced that its oil production had topped that of ExxonMobil. PetroChina produced 2.43 million barrels of oil per day in 2011, whereas Exxon’s production was 2.3 million daily barrels. However, Saudi Aramco, which produced 7.9 million daily barrels of oil in 2011, dwarfed both these giants.

Image

Source: The Economist

The origins of the first state owned firms lies in the 50s and 60s, when the petro-states started nationalizing their oil resources by creating NOCs to take charge of their reserves. The Supermajors were still needed for their technical expertise, capital and skill at managing large projects. Most oil projects took the form of joint ventures between NOCs and the Supermajors. However, over time, the NOCs have become more technically advanced and competent at managing their own projects.

More importantly, state firms from China and South Korea, which do not control their own domestic reserves, have also started competing with the Supermajors via acquisitions to obtain technology, as well as access to oil and gas fields and drilling licenses. On July 23rd China National Offshore Oil Corporation, CNOOC announced a $15 billion deal to buy Nexen, a Canadian energy firm with big holdings in tar sands and expertise in drilling for shale gas. Last year, it had announced a $2.2 billion deal with Chesapeake Energy through which it acquired assets in South Texas shale deposits and agreed to finance most of Chesapeake’s drilling costs. These deals are of strategic importance to China. They provide China with access to foreign oil reserves, as well as the necessary technical expertise to access its own domestic shale gas reserves.

The Supermajors are also facing competition from firms that provide Oil Field Services (OFS). OFS firms provide the equipment and services used in the exploration for and extraction of Oil. The sector can be broadly divided into:

  • Technology solution providers such as FMC that sell products or kits.
  • Drilling contractors such as Transocean that own and lease out rigs to companies.
  • Oilfield services providers that carry out most of the tasks involved in finding and extracting oil. Schlumberger, Halliburton, Baker Hughes and Weatherford international dominate this subsector.

OFS started growing as a sector in the 1980s when the oil companies decided to outsource drilling operations. At that time, the easy availability of oil resulted in relatively low margins on drilling operations. Since the 1990s, the tightening oil market has driven demand for new technologies for exploration and extraction of oil. The big service companies invest heavily in R&D. Schlumberger, which earned profits of $5 billion on revenues of $40 billion in 2011, invests roughly $1 billion annually on R&D. That is roughly the same as the R&D expenditure of Exxon. Technologies and techniques such as 3D seismology and directional drilling, developed by OFS firms, are the mainstay of the modern oil industry.

The dependence on new technologies is also likely to grow. Global production from mature oil fields is falling by between 2% and 6% annually. The dwindling supply and increasing demand for oil means that the oil companies are more and more dependent on OFS firms for the technology and services to extract oil from increasingly inaccessible reserves and remote locations.

The OFS firms have also played a role in reducing the dependence of the NOCs on the Supermajors for technical and managerial expertise. NOCs can now manage projects themselves and hire all the technical help they require directly from OFS firms. This can extend to the extent of risk sharing between the NOCs and the service firms, just as in joint ventures between oil companies. Schlumberger agrees to some amount of payment for performance on big contracts. Others, such as Petrofac, are taking small equity stakes in exploration projects.

So, overall, a number of other players are replacing the Supermajors. As far as owning reserves is concerned NOCs have claimed the best acreage in most of the old oilfields. The large OFS firms are the leaders as far as technical expertise at drilling and extraction is concerned. In spite of the Supermajors’ expertise at exploratory activities, smaller oil majors such as Tullow, Carin and Andarko are proving to be more capable at the task of discovering new reserves.

However, in spite of their diminishing role, Supermajors are obviously still a major part of the industry. Even technically advanced NOCs like Kuwait Oil and Saudi Aramco still depend on the Supermajors for downstream activities such as refining. New petro-states such as Uganda and Ghana do not have the capital, technology or managerial skills required to exploit their oil resources, and would prefer to deal with firms that have a reliable track record of successfully funding and managing big projects. OFS firms such as Schlumberger claim that they do not intend to own reserves. In addition, they do not have the finances to manage the risk associated with large exploration projects. Thus the Supermajors are the only players who can mobilize the technical expertise required to find and extract oil from harsh environments such as the Arctic, and deep oceans and from unconventional sources such as oil sands. Supermajors also have an advantage over smaller firms in the biggest capital-intensive projects such as the large Liquefied Natural Gas (LNG) projects managed by Shell in Australia, and Total in Russia.

In spite of their ever-increasing profits, it is fair to say that life has become a lot more difficult for the Supermajors. The industry has become move diversified and complex. A number of state-owned and private players are playing a large role in moving the oil.

-by Anubhav Bhattacharjee

Anubhav is a PGP-1 student at IIM, Ahmedabad and currently a member of the Consult Club here. He graduated from the Indian Institute of Technology, Madras in 2012

Note – A typographical error in the post was corrected on 28th August 2012. The profits quoted from Fortune 500 are in $ Billion and not $ Million. 

The Economic Impact of Mega Sporting Events

Bloomberg reported in 2008 that an estimated US$20 billion was spent on that year’s Olympic Games in Beijing. In fact, IMF estimates that about US$ 36 billion was spent on Olympic-related infrastructure in Beijing in the run up to the games. The spending by China on the Olympics was greater than the national GDPs of 83 countries in the world (IMF estimate). The last few decades have seen several billions of dollars being spent by nations across the world in hosting large international sporting events – the so-called ‘mega events’. One wonders if huge expenditures over world-level events like the Olympics, the World Championships and regional-level events like the Asian Games are justified. One of the most compelling arguments supporting cities bidding heavily for these events is the expected economic windfall brought by hostingthem.
World-level events, led by the Olympics, have become increasingly expensive over the years. Host cities see this not only as an opportunity to build new sports infrastructure but also improve urban infrastructure including housing facilities, communication networks and public transport. Such huge expenditures had led to 21 of the first 25 editions being hosted largely in Western Europe, North America and Australia. With growing concerns of potential terror attacks, security costs have also ballooned over the last decade. It is estimated that the security expenditures associated with the 2002 Salt Lake City Winter Games and the 2004 Athens Summer Olympics were over US$ 300 million and US$ 1 billion respectively. Security expenses largely come from the country’s Federal budget and arenot included in the games’ budgets. Further, there are annual maintenance costs of large stadia and associated sports infrastructure. Private sector companies might be hit by long term costs. Hotels might have seen a construction boom but the surplus capacity might create downward pressure on room rents in subsequent years. It is reported that within 5 years of the 1994 Lillehammer (Norway) Winter Games, 40% of the hotels in the region had gone bankrupt. Despite these shortcomings, estimating the cost associated with hosting a mega sporting event is far easier and reliable than estimating the revenues and economic benefits that a city derives from it.
The Sydney Olympic Games (2000) was expected to have a US$ 6.3 billion positive impact in addition to the creation of 100,000 new jobs. The Athens Olympics (2004) is estimated to have boosted economic activity by 1.3% of GDP every year between 1997 and 2005 and reduced unemployment by 1.9% per year. Prediction studies typically derive economic benefit studies from –direct impact (number of days spent by a visitor x number of visitors x average amount spent by a visitor) and indirect impact (effect of infrastructure spending). A key argument against the direct impact figure are that since leisure travellers’ budgets are inflexible, their spending on tickets simply leaves lesser money to spend on other substitute activities in the local economy. This suggests that the direct impact figure is likely to be overestimated. The effect of ‘crowding out’ local population spending is to be incorporated in addition to negative externalities such as congestion. Further, the issue of ‘time-switching’ is ignored: A visitor planning to visit Athens few months later might just have rescheduled his visit to coincide with the games. However, the latter effect is likely to be subdued for mega events like the Olympics.
The Indirect Impact is estimated by applying ‘multipliers’ to direct expenditures towards the event. These economic multipliers are derived from complex mathematical functions that model the relationships between different businesses in the region. However, when a world-level mega sporting event is happening in a region, some of these relationships do not hold. Another problem while estimating the Indirect Impact is the inability to separate the money flowing to international chains, in which case a foreign shareholder might derive greater benefit than the local population. Further, such leakages are aggravated by the entry of external firms that provide goods and services only during the games.  The benefits derived from the huge infrastructure investments presents yet another complication. Several secondary benefits accrue from heavy infrastructure spending surrounding a mega event. Improved connectivity, increased development of available real estate and even project management capability can derived. The property market in the region is buoyant following an event of this scale. Labour market impact and the socio-economic inclusion of a larger set of people is harder to quantify.
There are numerous intangible benefits that a city or nation derives from hosting a mega sporting event. Firstly, the city gets a ‘status-lift’ making its mark at the world level and rising into the echelons of ‘world cities’. Some studies show ‘a restoration of self-confidence’, ‘civic pride’ and ‘dynamism’ among the citizens following a mega event. The 2008 Beijing Olympics made an attempt of showcasing itselfas a democratic, civilized and harmonious country. In some countries, such events are used as a legitimate excuse to get legislative approval for infrastructure and other projects that might otherwise not be possible.
Despite the less-than-accurate estimates of cost and revenues associated with a mega sporting event, hosting the Olympics has remained an elixir of sorts used by governments across the world. Large caveats that come along with the prediction models have not tempered the gigantic bids cities make to host such world-level and inter-continental events. Do the economic, fiscal, political, social and cultural benefits outweigh the public expenditure of gargantuan proportions? Only time will tell.